Definition and basic concept of spectrophotometer
A spectrophotometer is a scientific instrument that qualitatively analyzes and quantitatively determines substances based on their selective absorption characteristics of light. Its basic operating band covers the ultraviolet region (typically 200-400 nm), the visible region (400-760 nm), and part of the near-infrared region. This instrument obtains information on the absorption spectrum or concentration of a substance by measuring the absorption of a specific wavelength of light by a sample solution. The UV-Vis absorption spectroscopy based on spectrophotometry is essentially the characteristic spectrum produced by the transition of electrons in molecules between energy levels, so it is widely used to study the structure, purity and content of compounds.
Principle Lambert-Beale's law
The mathematical basis for quantitative analysis of spectrophotometers is Lambert-Beale's law. This law describes the relationship between the absorption of monochromatic light by a substance and the concentration of the absorbing substance and the thickness of the liquid layer. When a beam of parallel monochromatic light passes vertically through a homogeneous, non-scattering solution with a certain optical path, the absorbance of the solution is directly proportional to the concentration of the absorbing substance and the product of the optical path. Its mathematical expression is:
A = log(I0/I) = ε c l
where A represents absorbance, I0 is the intensity of the incident light, and I is the intensity of the transmitted light; ε is the molar absorbance coefficient, which indicates the absorption capacity of a substance to a specific wavelength of light; c is the concentration of light-absorbing substances in the solution; l is the length of the path of light through the solution, i.e. the path of the cuvette. The Lambert-Beale law is the theoretical cornerstone of all subsequent quantitative analysis methods, and the design and operation of the instrument revolves around how to accurately measure the absorbance A value.
Main measurement methods
In the practical application of spectrophotometers, the following measurement methods are mainly used according to the different analytical purposes and sample characteristics:
Standard curve method.This is the most widely used quantitative method. A series of standard solutions at known concentrations are first prepared to determine their absorbance at the selected wavelength. The standard curve is drawn with concentration as the abscissa and absorbance as the ordinate. The absorbance of the unknown sample is then determined under the same conditions, and the concentration of the sample can be calculated using a standard curve. This method requires good linearity and reproducibility of the standard curve.
Standard accession method.This method is often used when the sample matrix is complex and there is matrix interference that is difficult to eliminate. A known amount of the standard solution was added to an aliquot of the sample solution and its absorbance was determined separately. The concentration of the added standard solution is used as the abscissa and the absorbance is the ordinate, and the intersection point between the line and the abscissa is extended, which is the concentration of the sample solution. This method can effectively correct the measurement error caused by the matrix effect.
Dual-wavelength spectrophotometry.This method uses two monochromatic light of different wavelengths to alternately irradiate the sample solution and measure the absorbance difference between the two wavelengths. This technique is often used to determine turbid samples or multi-component mixtures, eliminating the interference of background absorption and scattered light without complex sample preparation, and improving the selectivity of measurement.
Kinetic determination.By continuously monitoring the change of absorbance at a specific wavelength of the reaction system over time, the reaction rate constant or initial rate is calculated, and then the initial concentration of the DUT is determined. This method is commonly used for enzyme activity assays and for the analysis of certain chemical reaction rates.
Key factors that influence measurement
To ensure the accuracy and reliability of spectrophotometer measurement results, the following influencing factors need to be paid attention to:
Wavelength accuracy vs. spectral bandwidth.The consistency of the instrument's wavelength indication with the actual output wavelength directly affects the measurement results, especially in measurements where the absorption peaks are relatively sharp. Spectral bandwidth affects the accuracy of resolution and absorbance, and excessive bandwidth may lead to deviations from Lambert-Beale's law.
Cuvette matching and cleanliness.The cuvette used to hold the sample and reference solution should have the same optical path and optical properties. Fingerprints, scratches, or residual stains on the cuvette surface can alter the light transmission, introducing significant measurement errors.
Solvent and pH effects.Many compounds experience altered absorption spectra under different solvent or pH conditions, such as shifting the position of absorption peaks or changing absorption coefficients. Therefore, the solvent composition and pH of the sample solution should be consistent with the standard solution.
Chemical factors: deviation from Lamber-Bill's law.When the solution concentration is too high, the distance between the absorbing particles decreases and the interaction is enhanced, resulting in a change in the molar absorbance coefficient and a deviation from the linear relationship. In addition, chemical equilibrium (e.g., association, dissociation) can also affect the actual concentration of light-absorbing substances.
The effect of stray light.Stray light refers to other wavelengths of radiation received by the detector that should not be present in the optical path of that wavelength. Stray light lowers the upper limit of absorbance measurement, causing the standard curve to bend in the high-concentration region, which is a major factor affecting the measurement accuracy of high-absorbance samples.
Main application areas:
The applications of spectrophotometers span several areas of scientific research and quality control:
Life Sciences & Biotechnology.For the detection and quantification of the purity of nucleic acids and proteins, such as the absorption of DNA and RNA at 260 nm and the absorption of proteins at 280 nm. At the same time, it is widely used in enzyme activity determination, cell proliferation and toxicity analysis, etc.
Chemical and pharmaceutical industries.Monitor the reaction process in organic synthesis, determine the content of pharmaceutical raw materials and preparations, detect the content in dissolution tests, and study drug stability.
Environmental monitoring.It is used for water quality analysis to determine ammonia nitrogen, total phosphorus, total nitrogen, hexavalent chromium, volatile phenols and other indicators in water; It is also used for the analysis of specific pollutants in the atmosphere and soil.
Food & Agriculture.Nitrites, food additives (such as colors, preservatives), protein content, and pesticide residues in food were measured.
Materials Science.Characterize the band gap of semiconductor materials, measure the transmittance and reflectance of optical films, evaluate the color properties of materials, etc.
Instrument selection reference points
In the laboratory planning and instrument procurement process, choosing the right UV-Vis spectrophotometer requires considering multiple dimensions:
Optical system design.It is mainly divided into two optical path designs: single beam and double beam. Single-beam instruments have a simple structure and low price, making them suitable for regular quantitative analysis. The dual-beam instrument can measure samples and references at the same time, automatically compensate for light source intensity fluctuations and detector drift, and has good stability, suitable for scenarios that require long-term scanning and kinetic determination.
Wavelength range and resolution.Determine the desired wavelength range based on daily analysis tasks. Conventional instruments covering 190-1100 nm can meet most needs. For fields that require fine spectral structure analysis, models with smaller spectral bandwidth and higher resolution should be selected.
Detector type.Traditional silicon photodiodes and photomultiplier tubes are still in use, while new instruments mostly use photodiode array detectors. The photodiode array detector enables instantaneous measurements at full wavelength, significantly increasing the speed of spectral acquisition, and is particularly suitable for rapid reaction kinetics and purity analysis of chromatographic peaks.
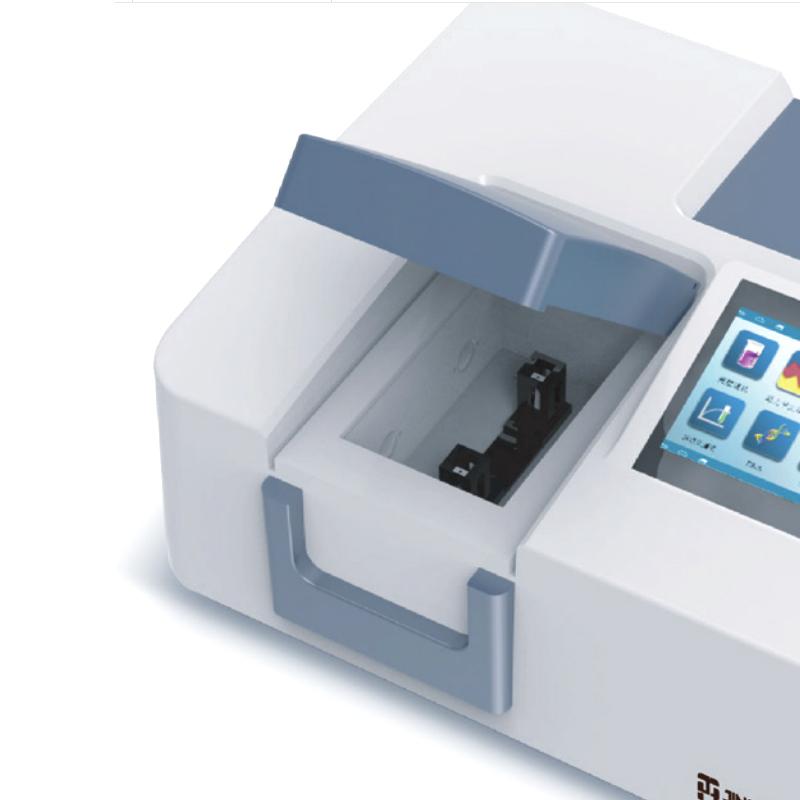
Sample chamber structure and accessory compatibility.Consider the size of the sample chamber and whether it can be easily installed with thermostatic accessories, solid sample holders, film accessories, or long-path cuvettes to meet diverse experimental needs in the future.
Performance metric validation.Pay attention to the technical parameters such as photometric accuracy, photometric repeatability, wavelength accuracy, baseline straightness, and noise level of the instrument, which directly determine the reliability of the measurement data.